xdebug
phpstorm配置xdebug
- PhpStorm 2021.3.2
- PHP 7.2.34
- Xdebug v2.7.2
https://www.jetbrains.com/help/phpstorm/configuring-xdebug.html
https://xdebug.org/
zend_extension=/usr/local/Cellar/php@7.2/7.2.30_1/pecl/20170718/xdebug.so
[xdebug]
;from Internet start
;xdebug.auto_trace=on
xdebug.remote_autostart=off
xdebug.collect_params=on
xdebug.collect_return=on
xdebug.remote_handler = "dbgp"
xdebug.remote_host = "localhost"
xdebug.remote_port = 9000
xdebug.idekey="PHPSTORM"
xdebug.remote_enable = on
;xdebug.trace_output_dir="/data/logs/php/xdebug_trace"
;xdebug.profiler_enable = on
;xdebug.profiler_enable_trigger = on
;xdebug.profiler_output_name = cachegrind.out.%t.%p
;xdebug.profiler_output_dir = "/data/logs/php/xdebug_profiler"
<?php
phpinfo();
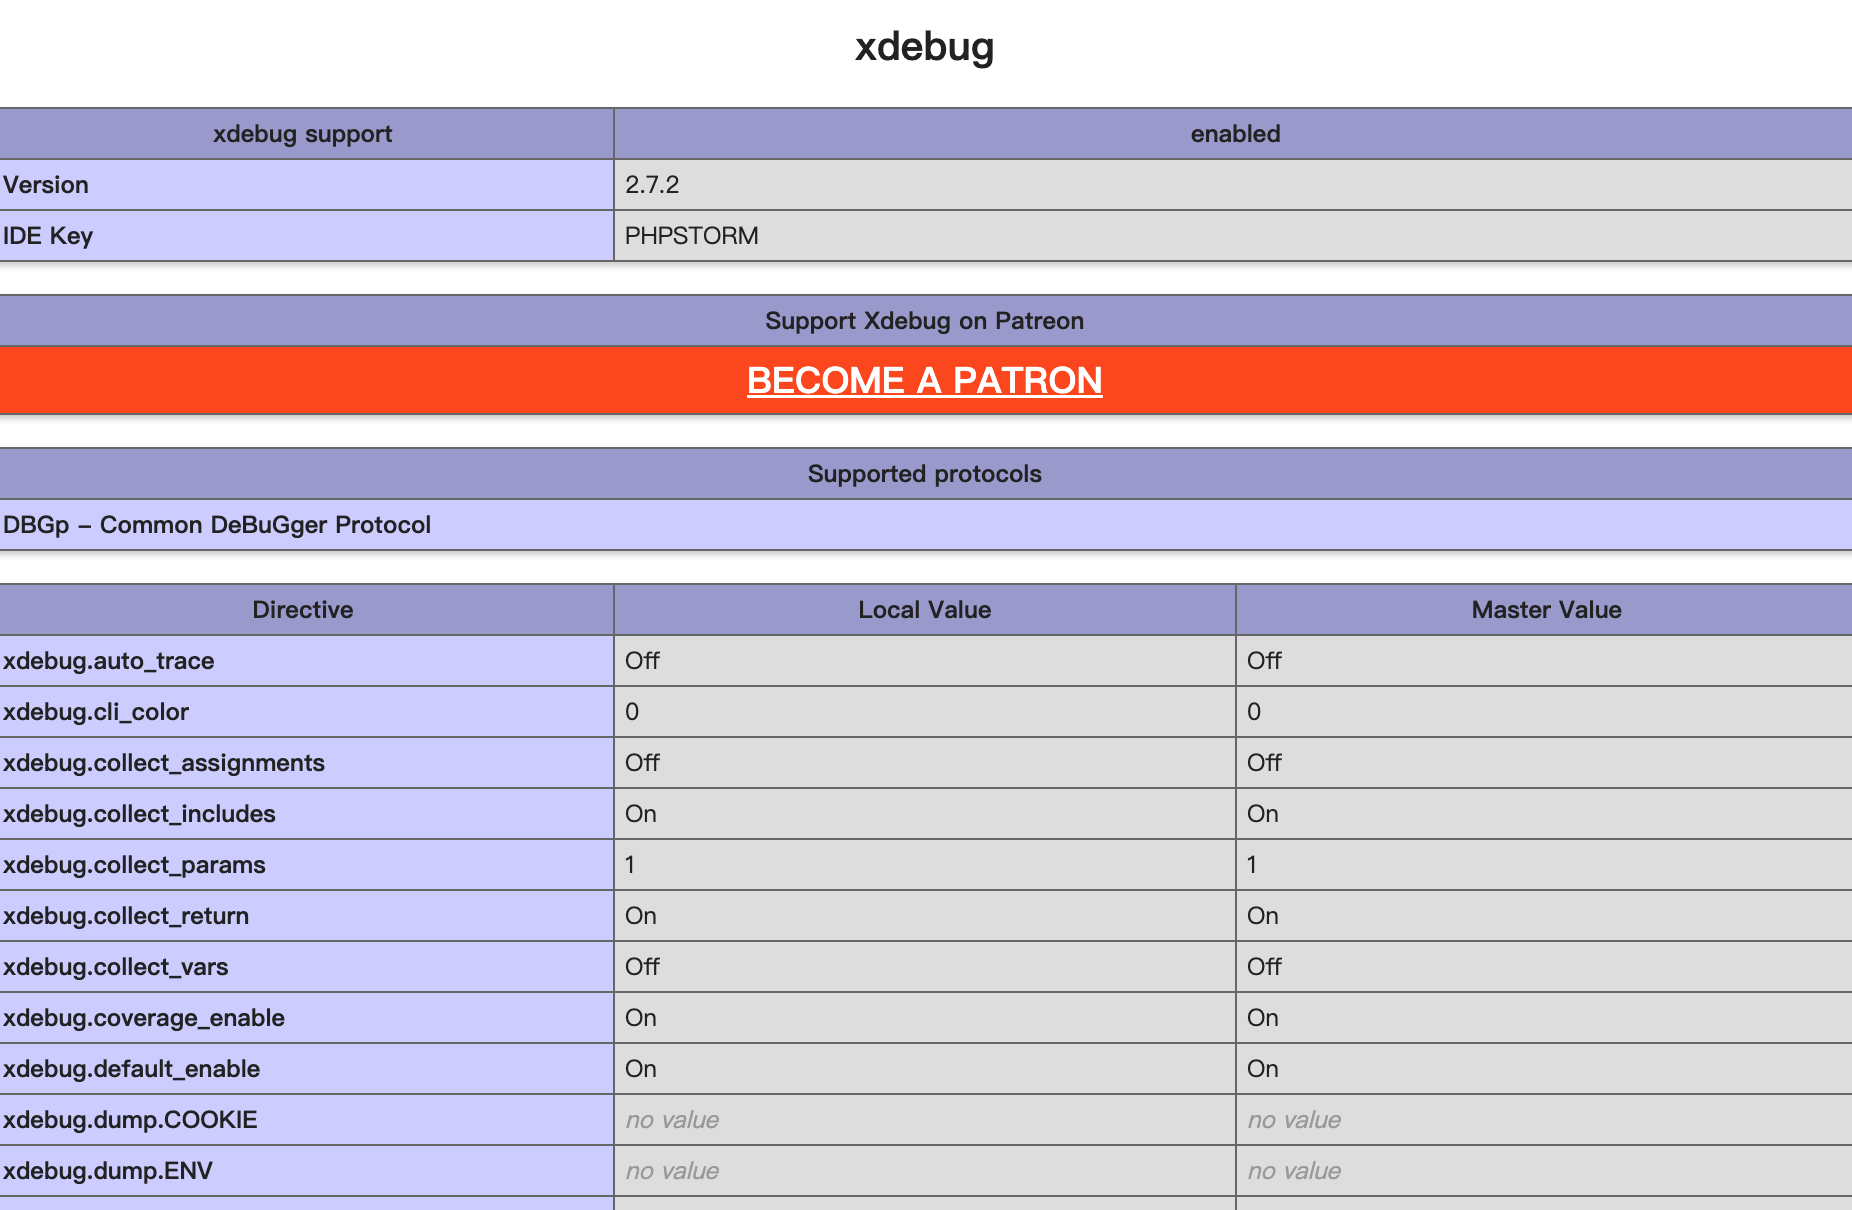
查看xdebug信息
PhpStorm
-
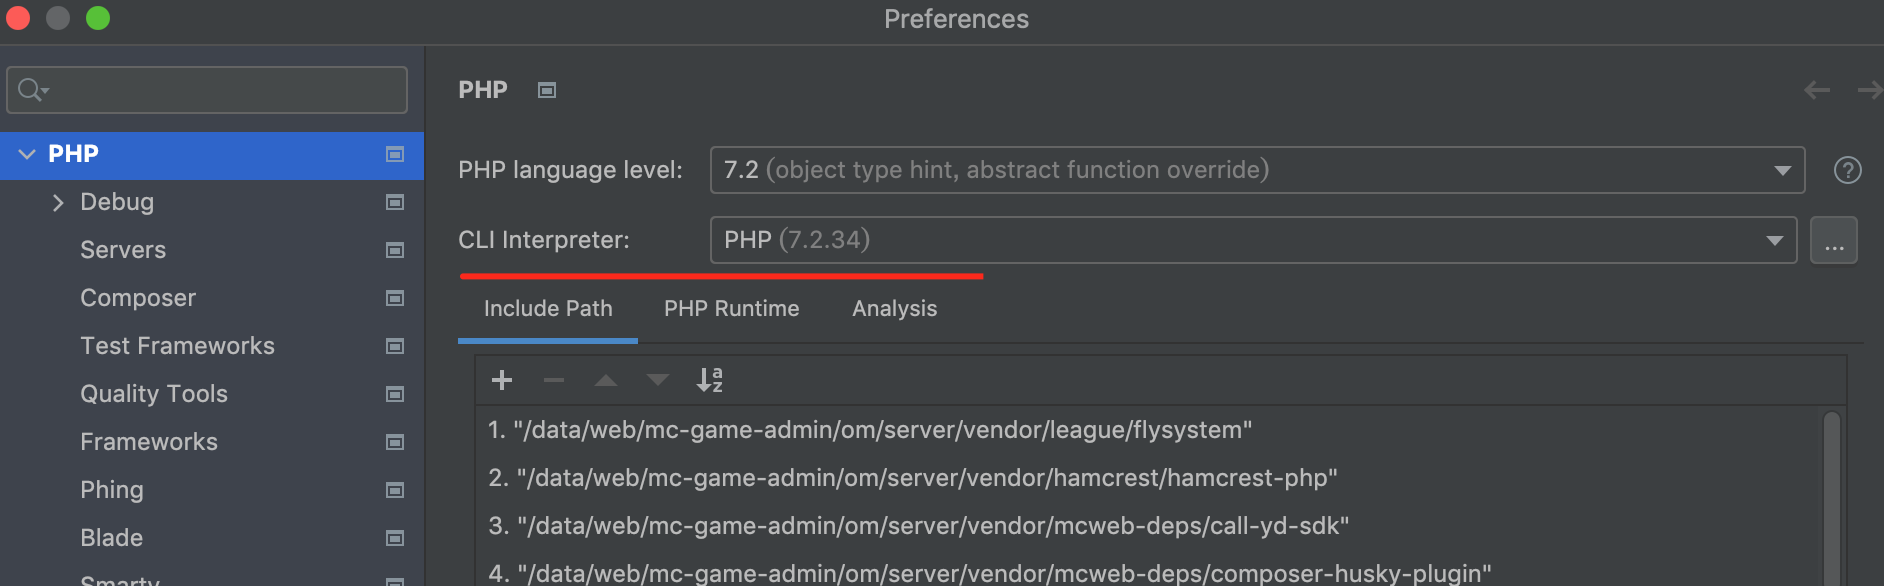
在“设置/首选项”对话框 ( ⌘ ,) 中,单击PHP。
-
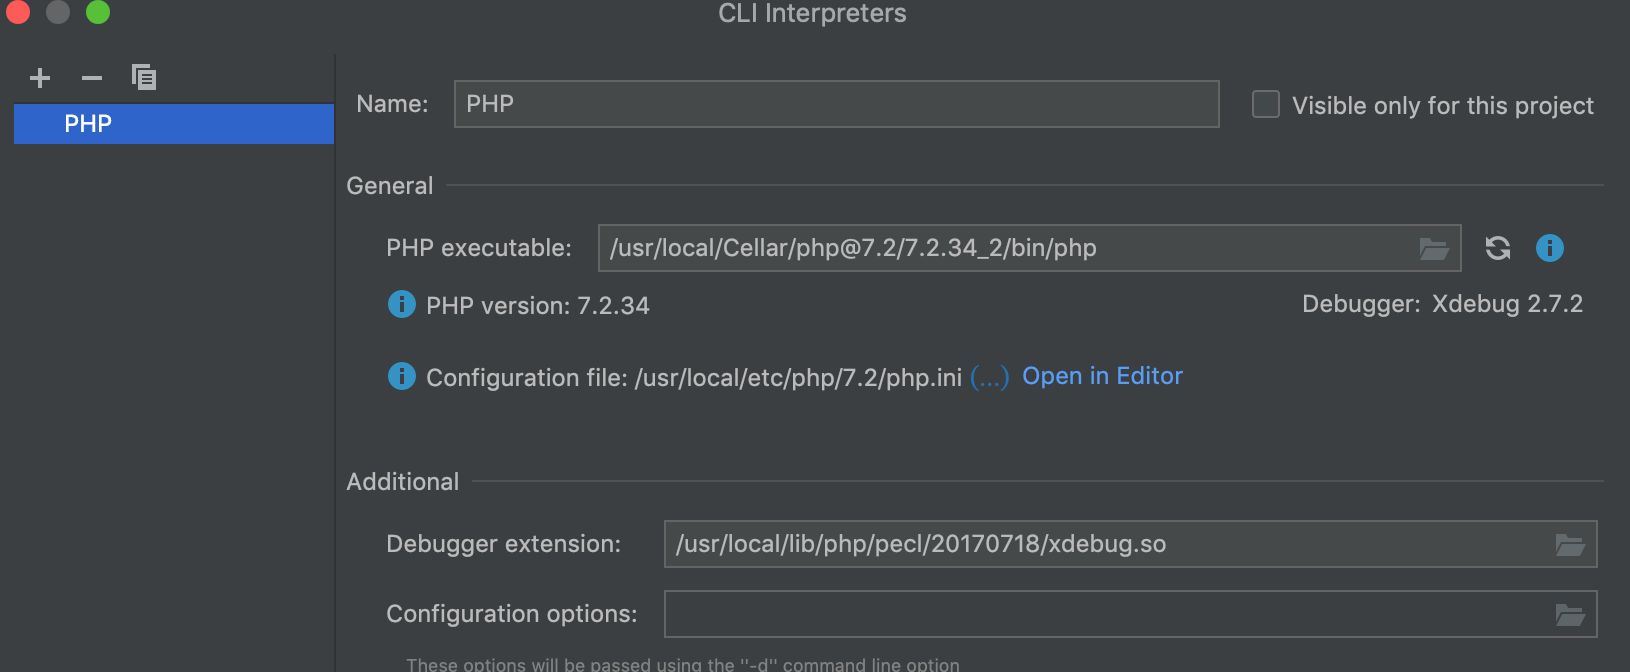
在打开的PHP页面上,单击CLI Interpreter字段浏览按钮旁边的
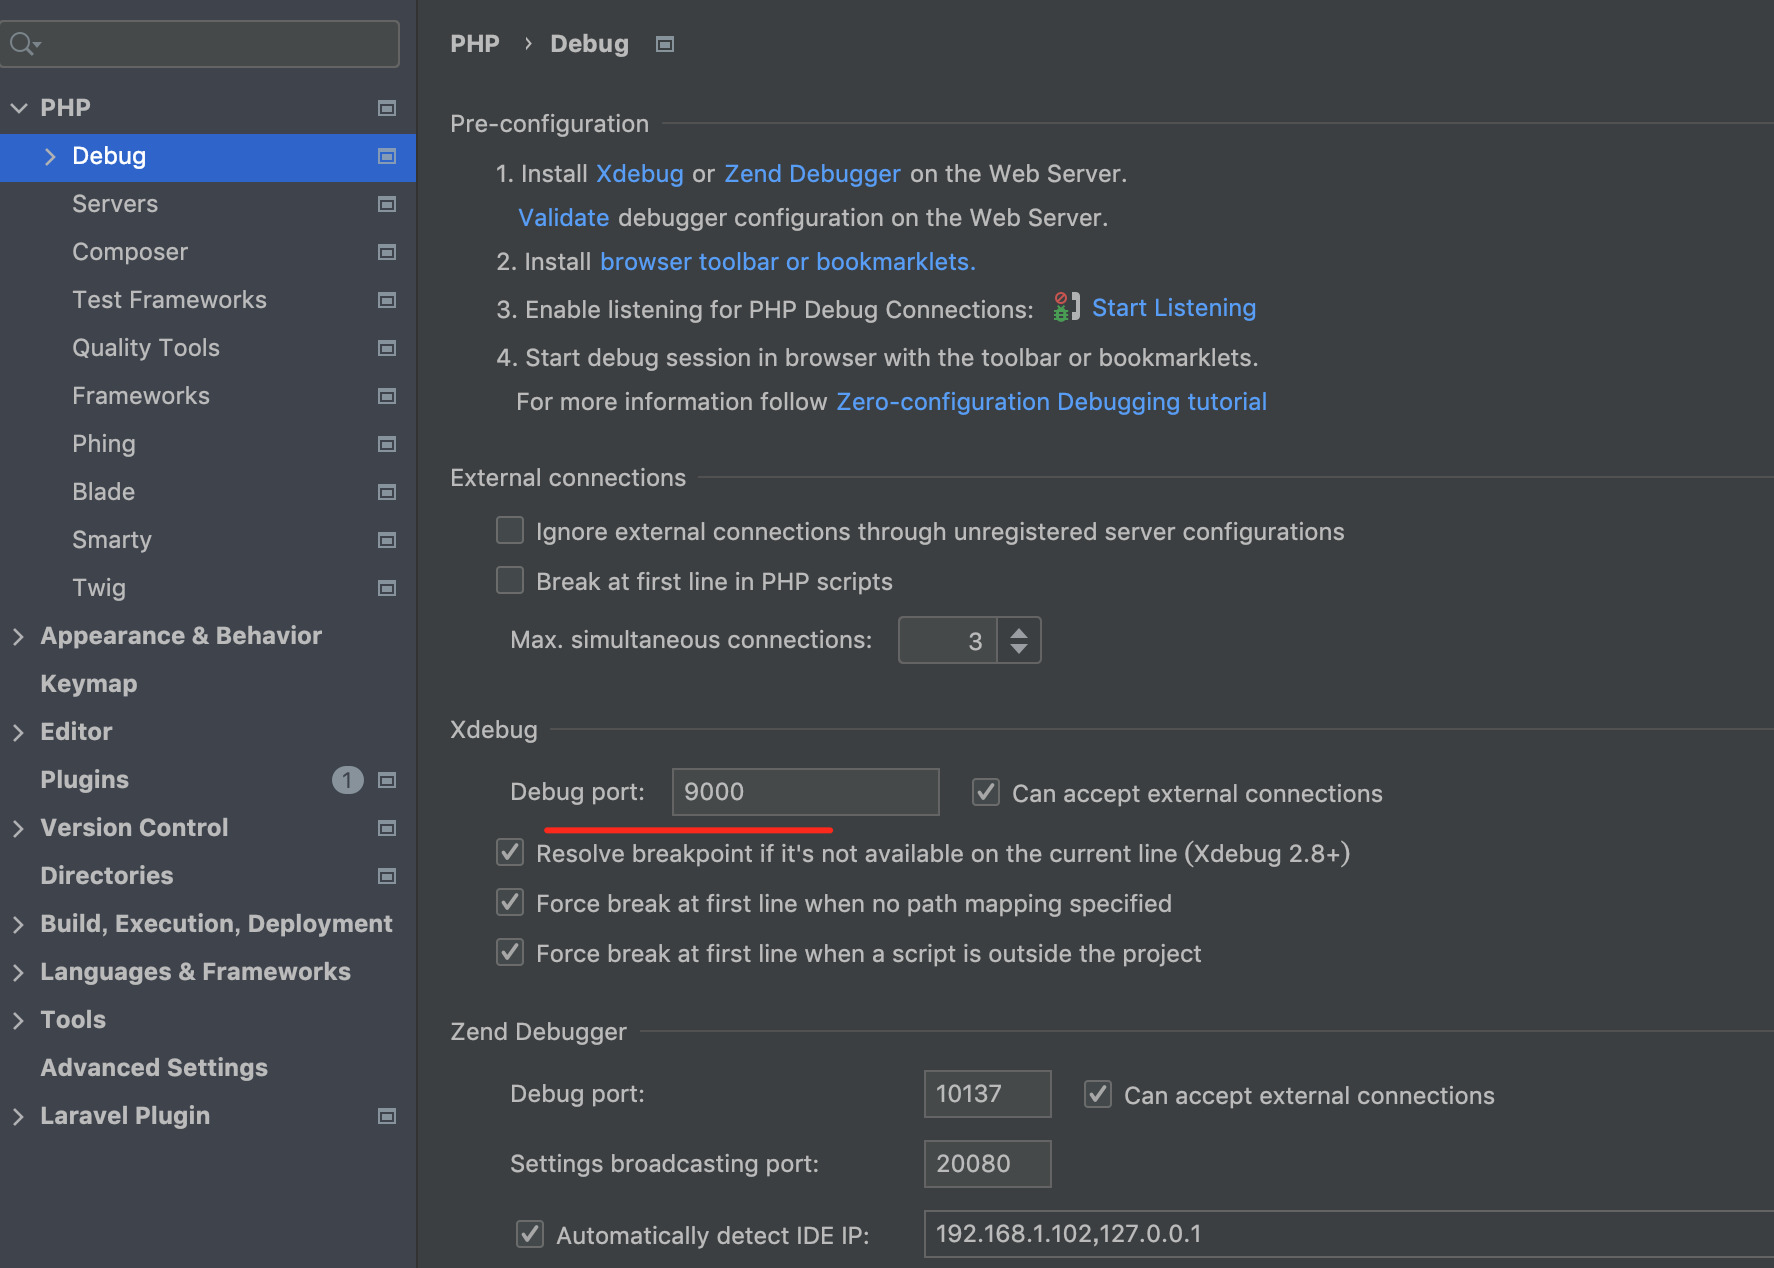
端口和php.ini的配置一致
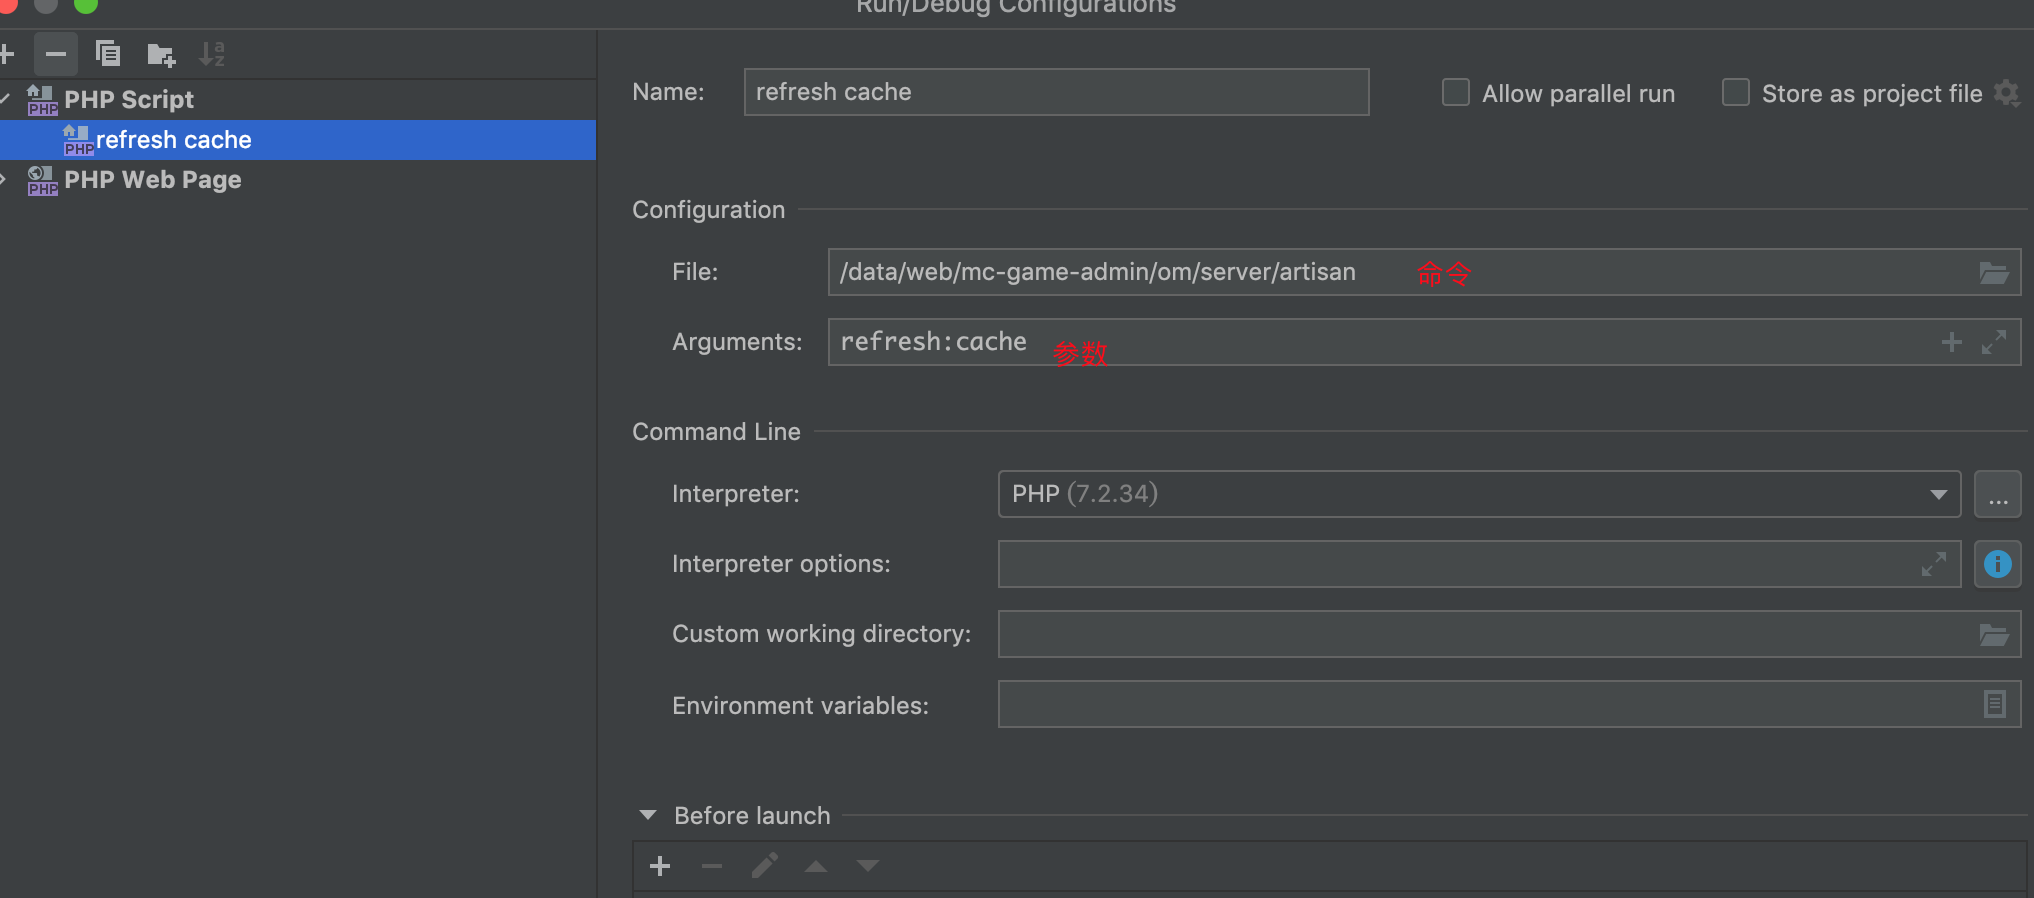
命令执行配置
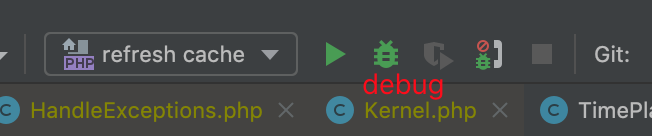
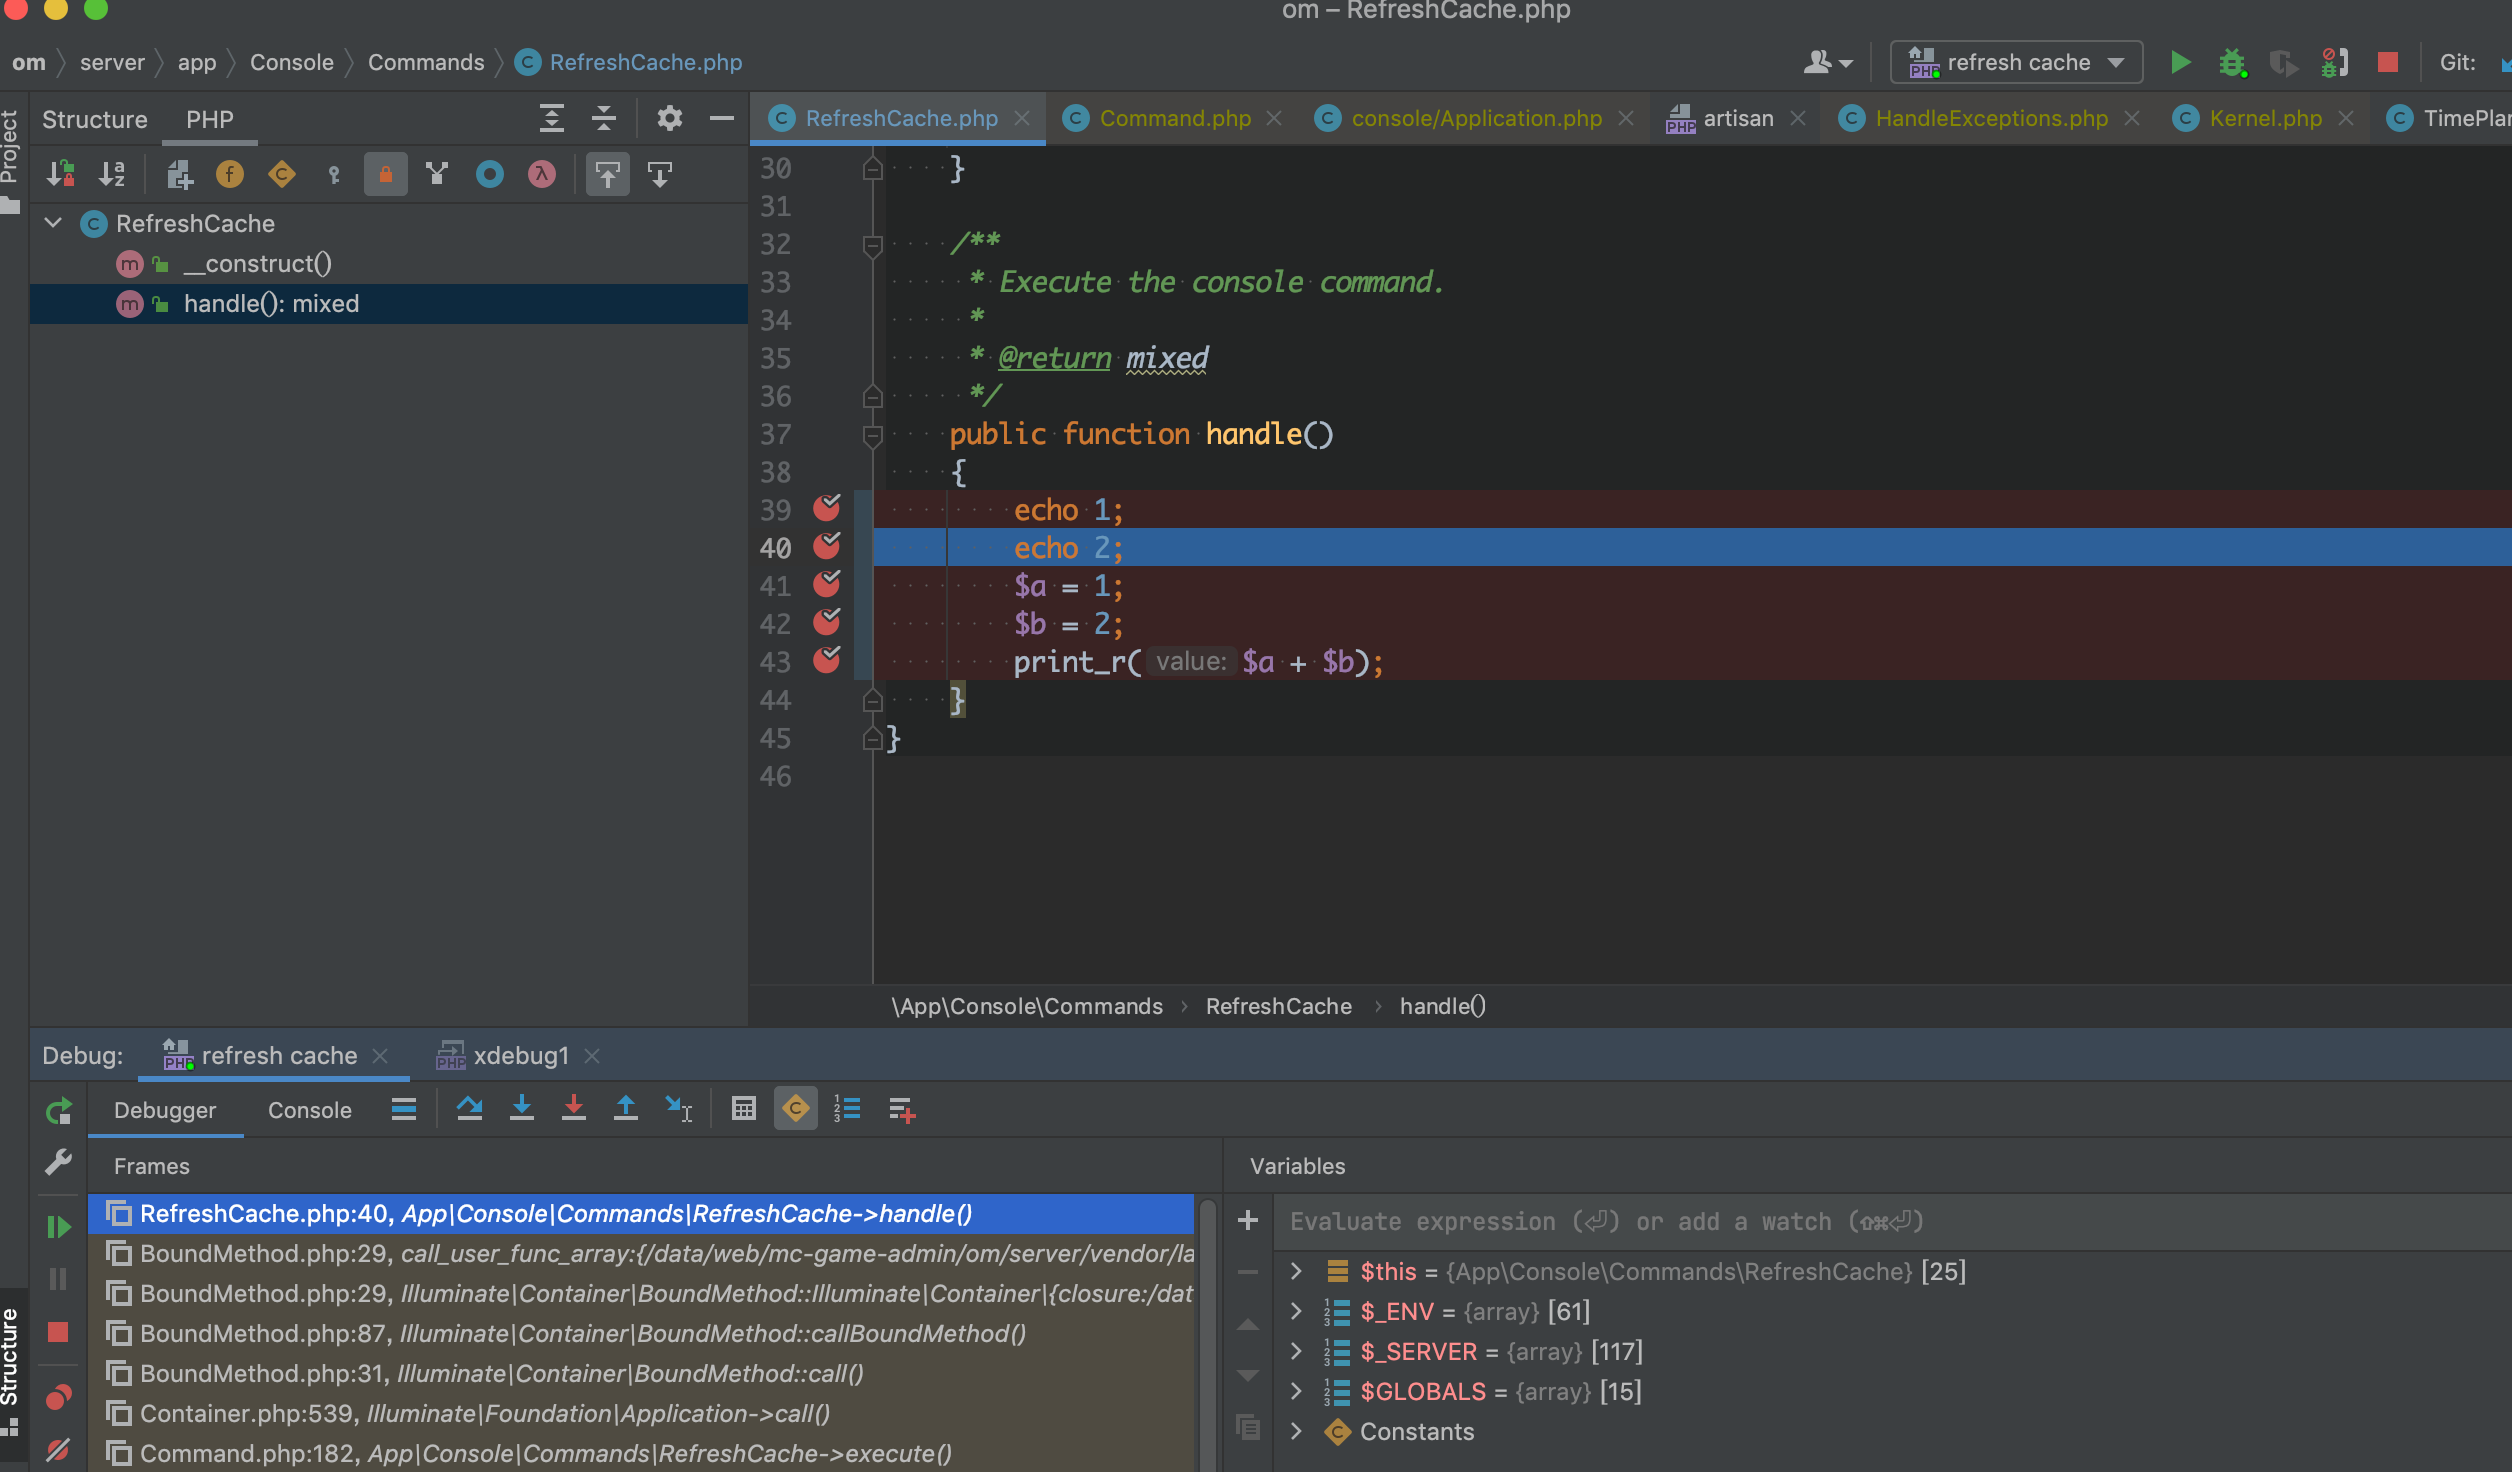
开始debug,F7执行下一步

测试执行
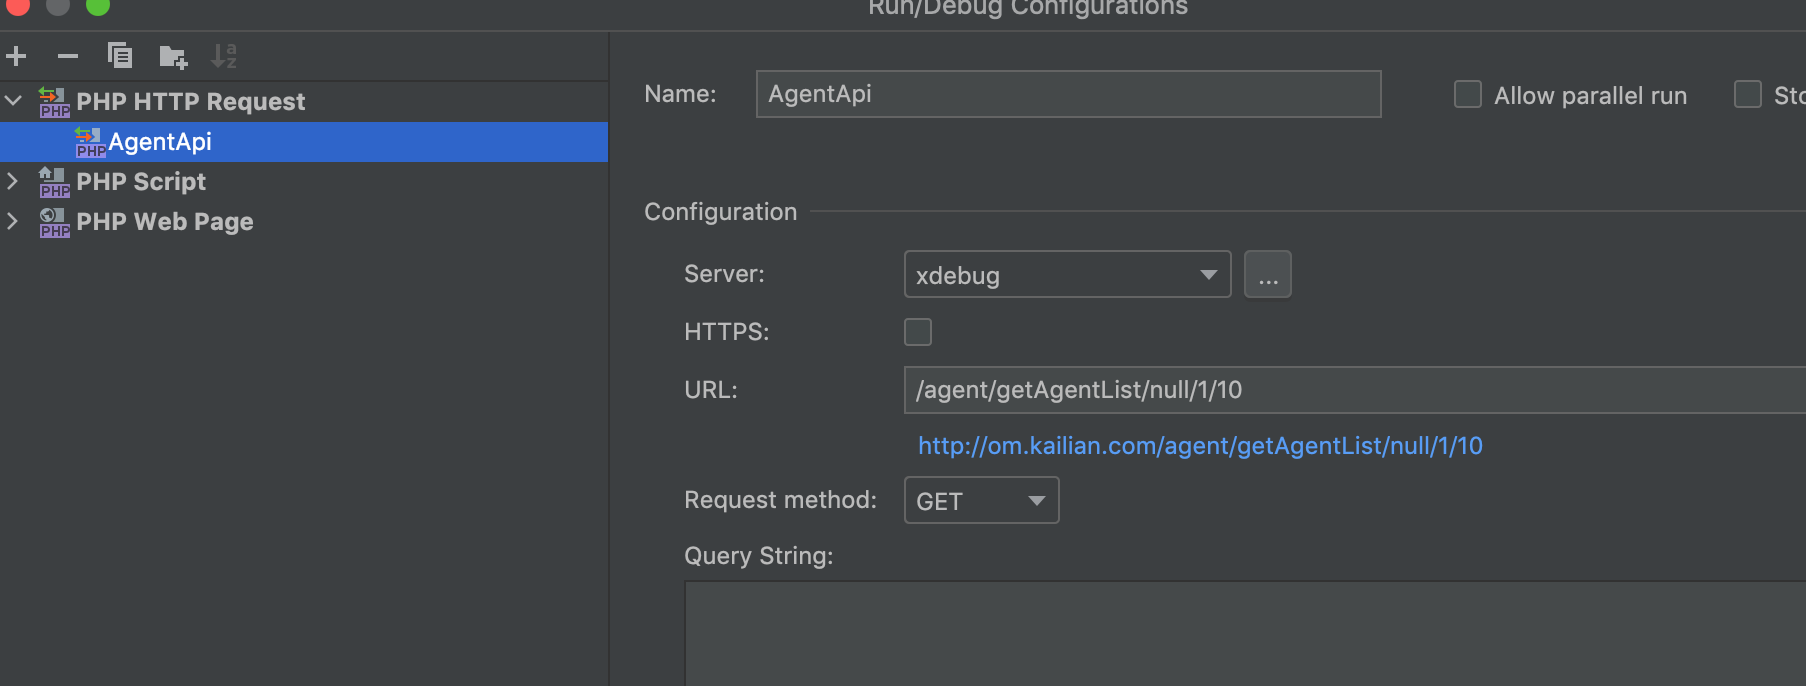
http 请求配置
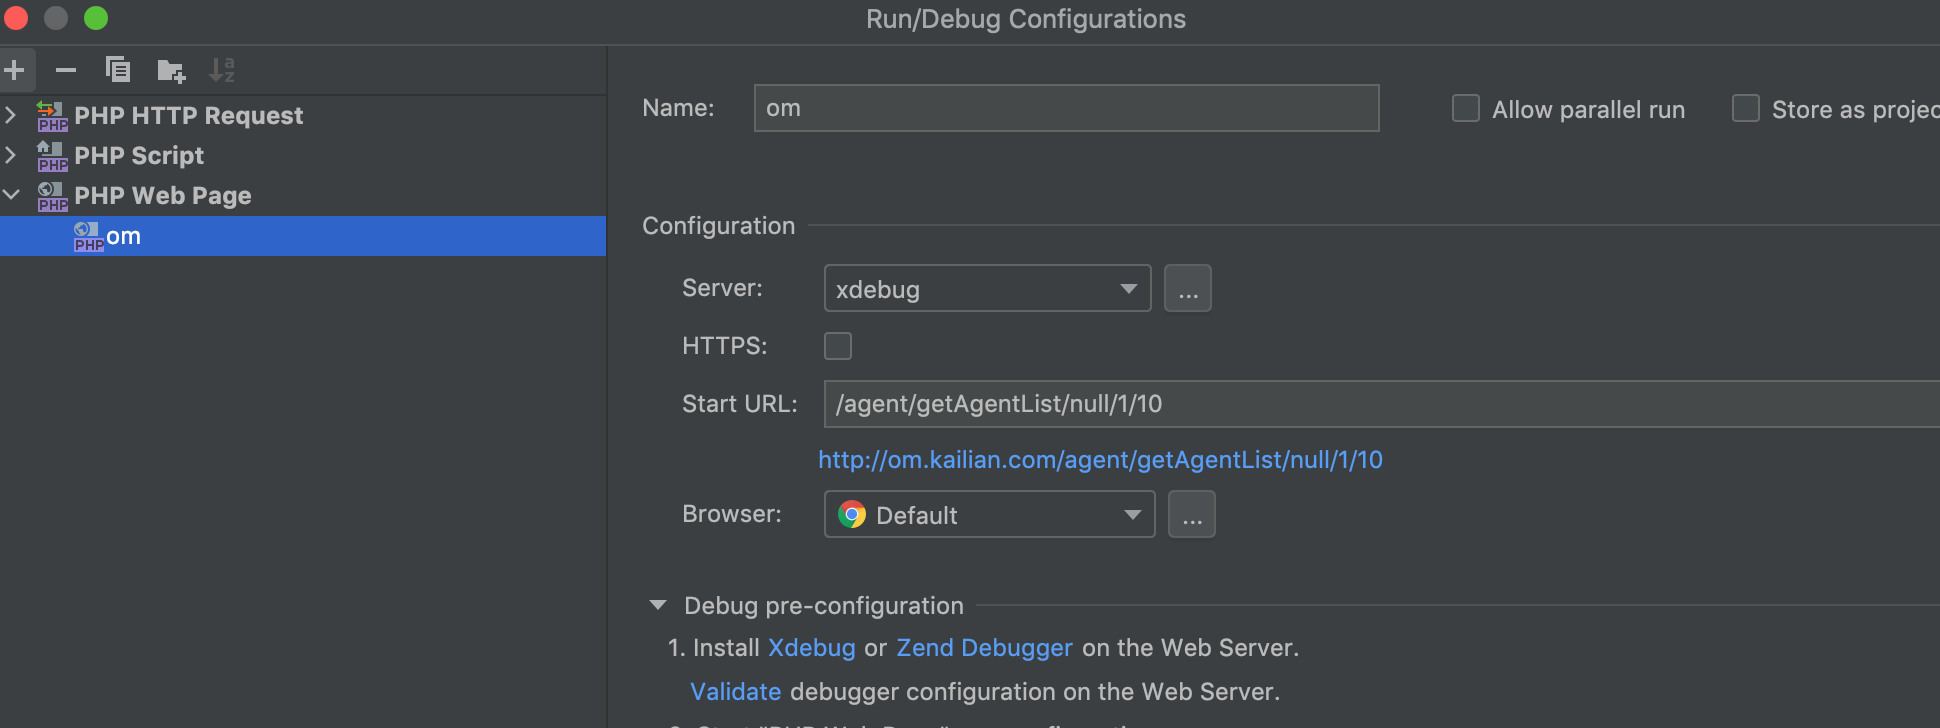
web page配置
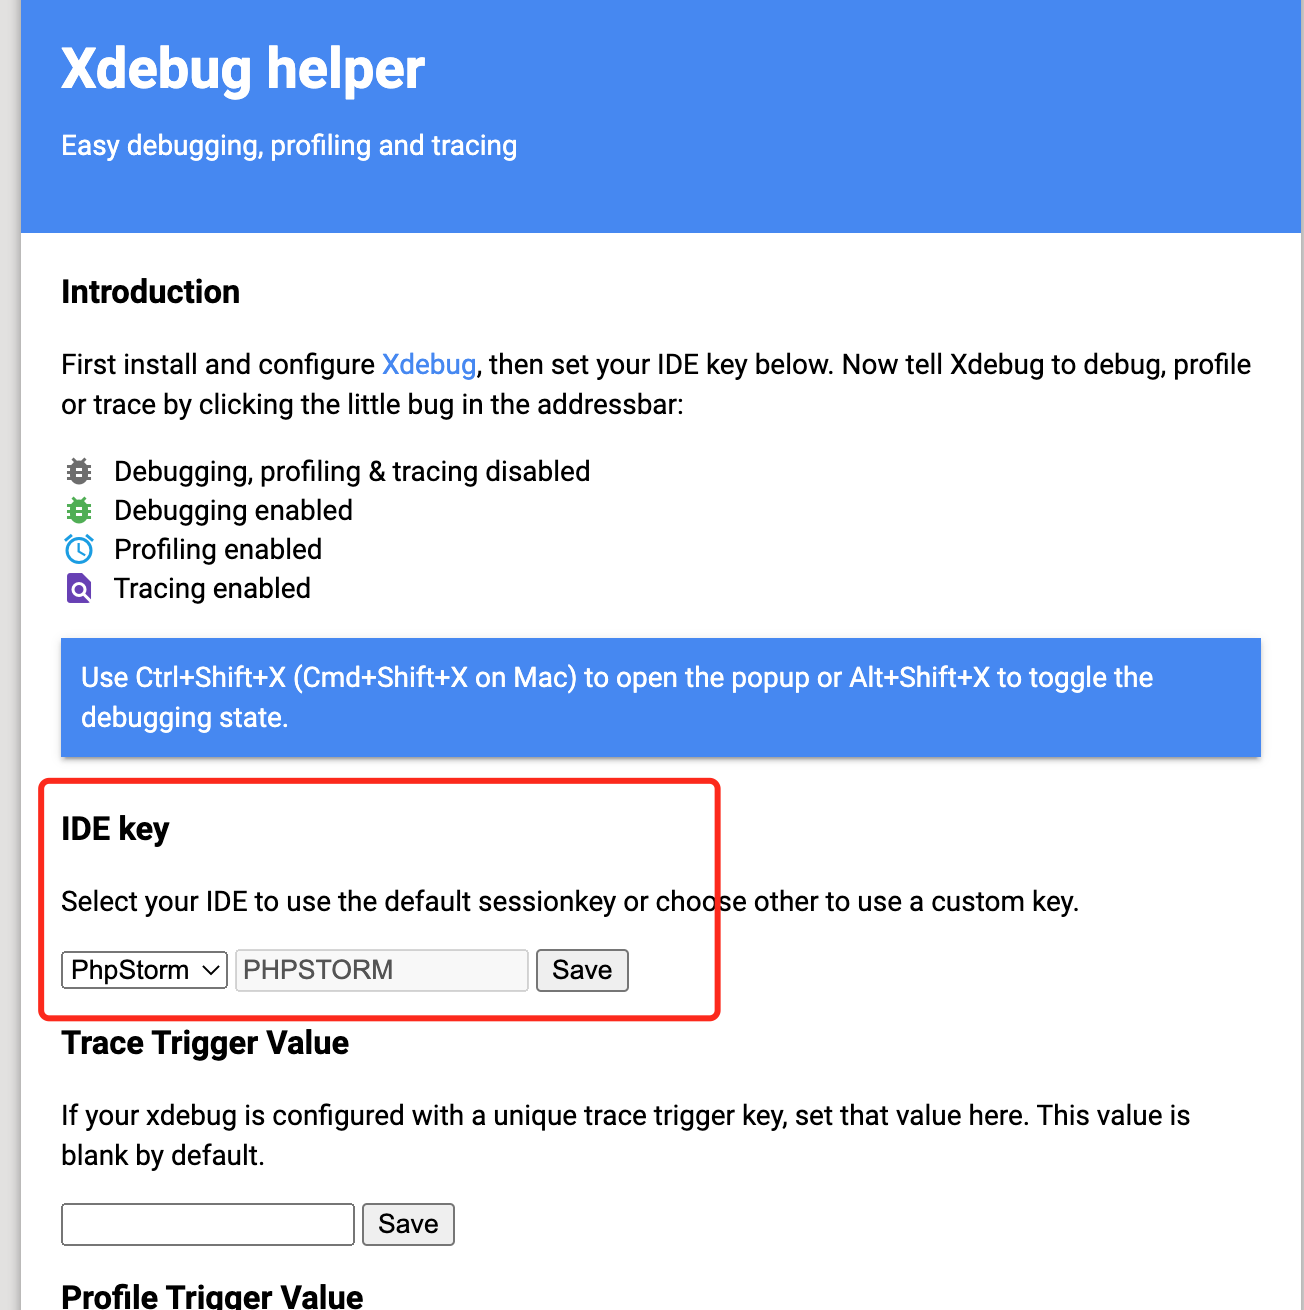
xdebug-helper配置,和php.ini 的idekey一直
xdebug profiler 做性能分析
xdebug性能测试
开启xdebug,访问请求慢的接口,收集信息到profiler_output_dir
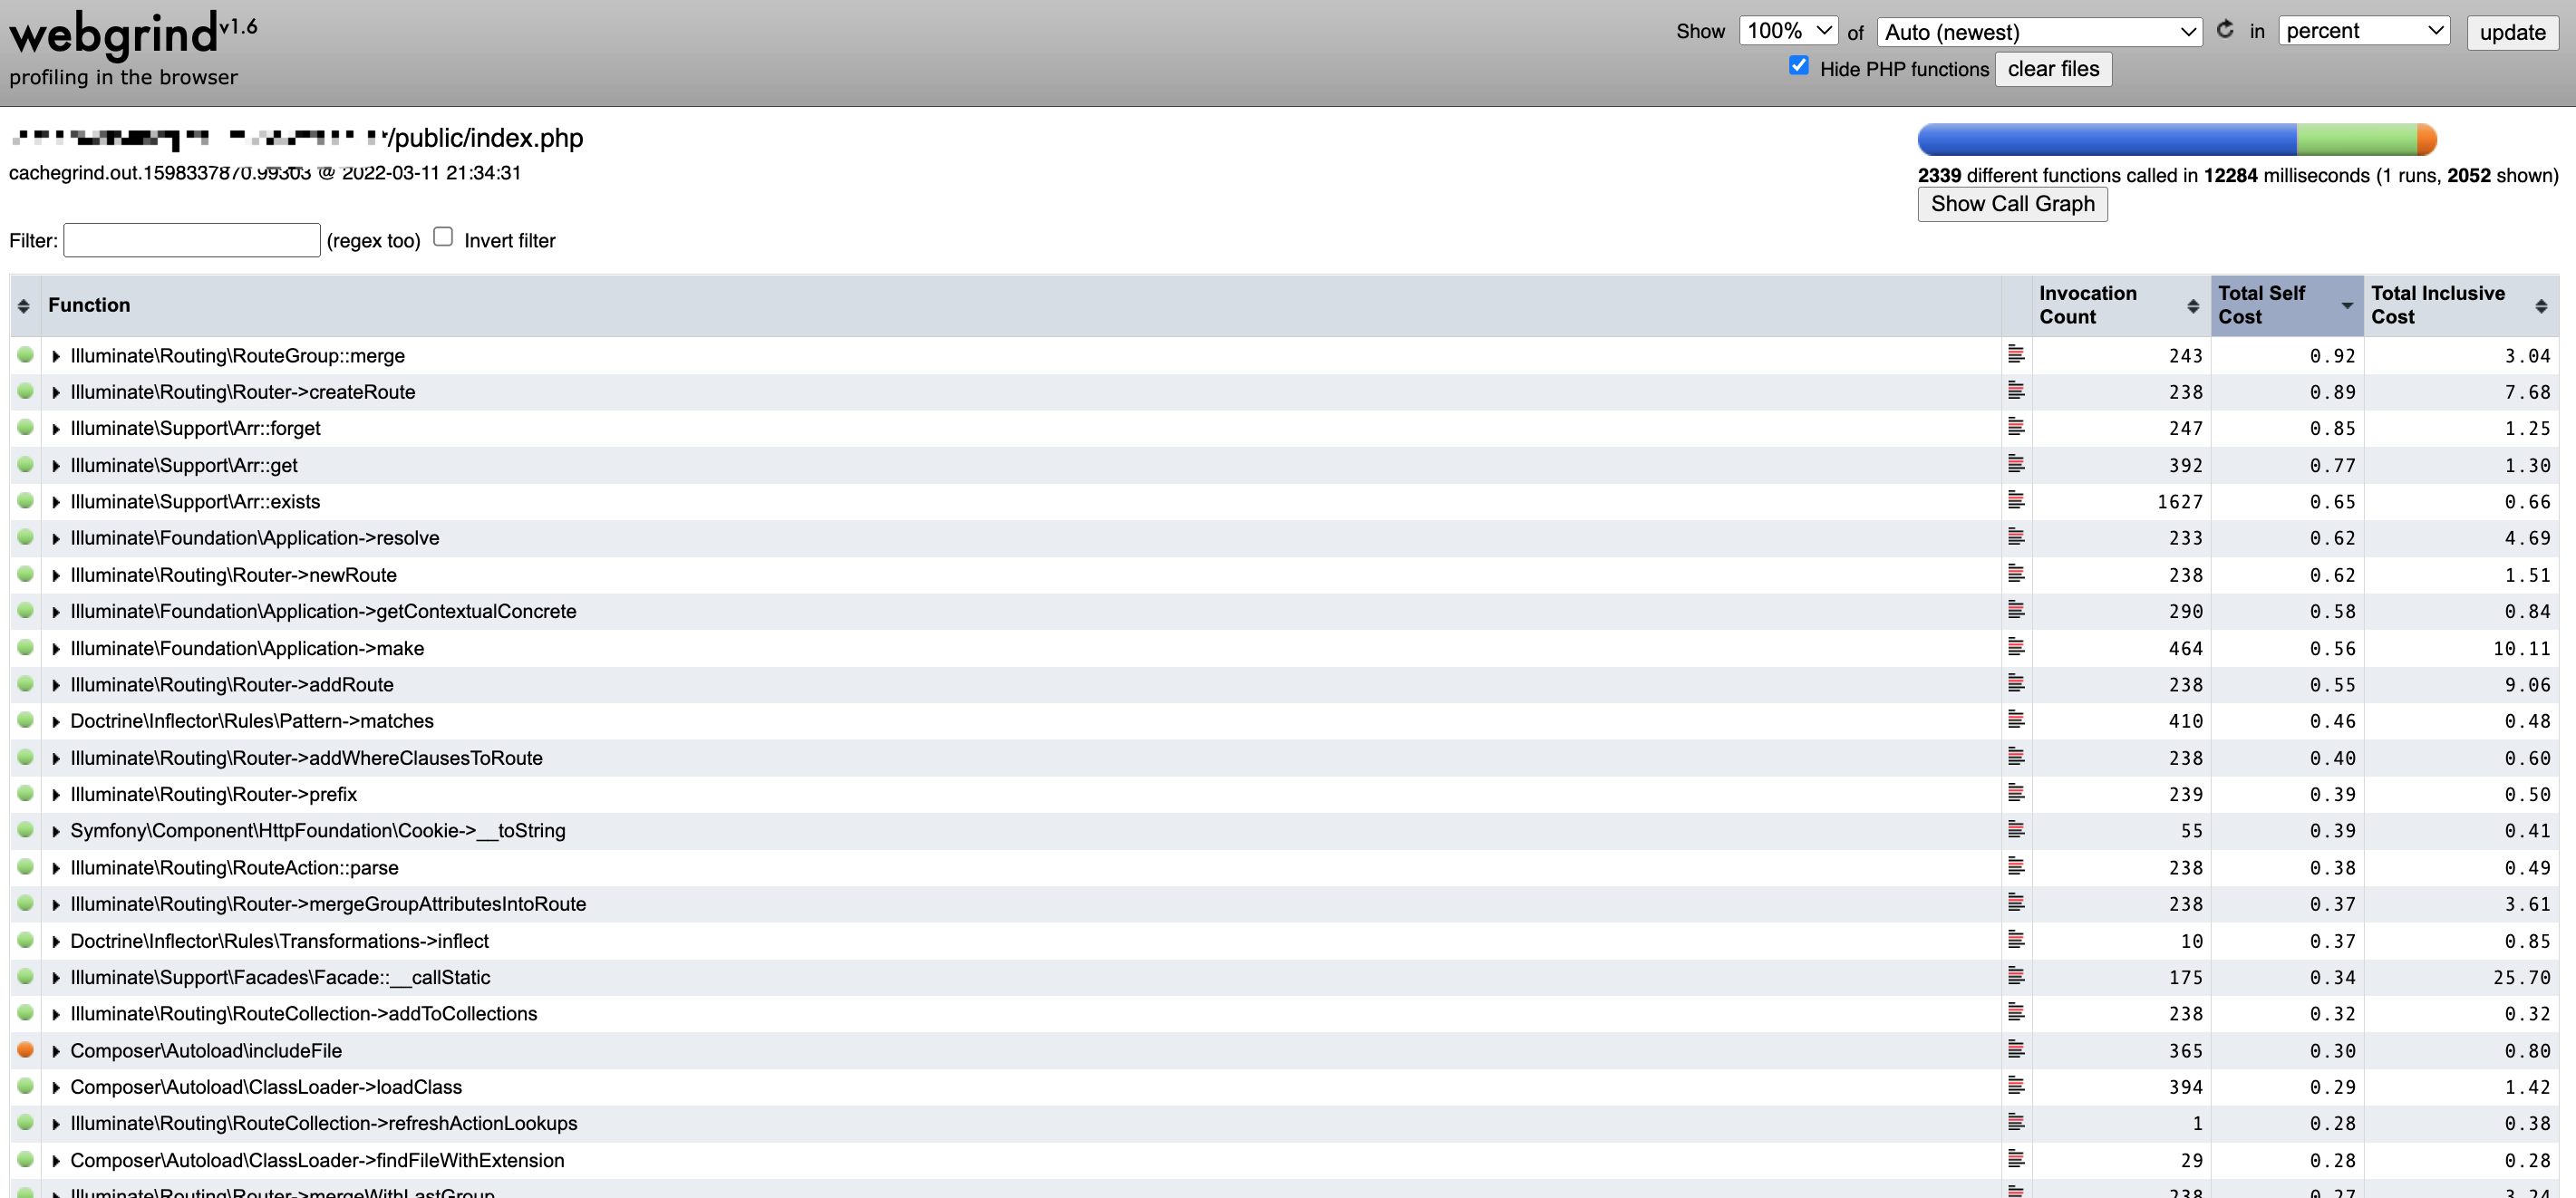
https://github.com/jokkedk/webgrind 可视化查看分析
依赖dot 命令
brew install doc

/usr/local/bin/dot
config.php 修改为xdebug.profiler_output_dir的目录
static $storageDir = '/data/logs/php/xdebug_profiler';
update 查看
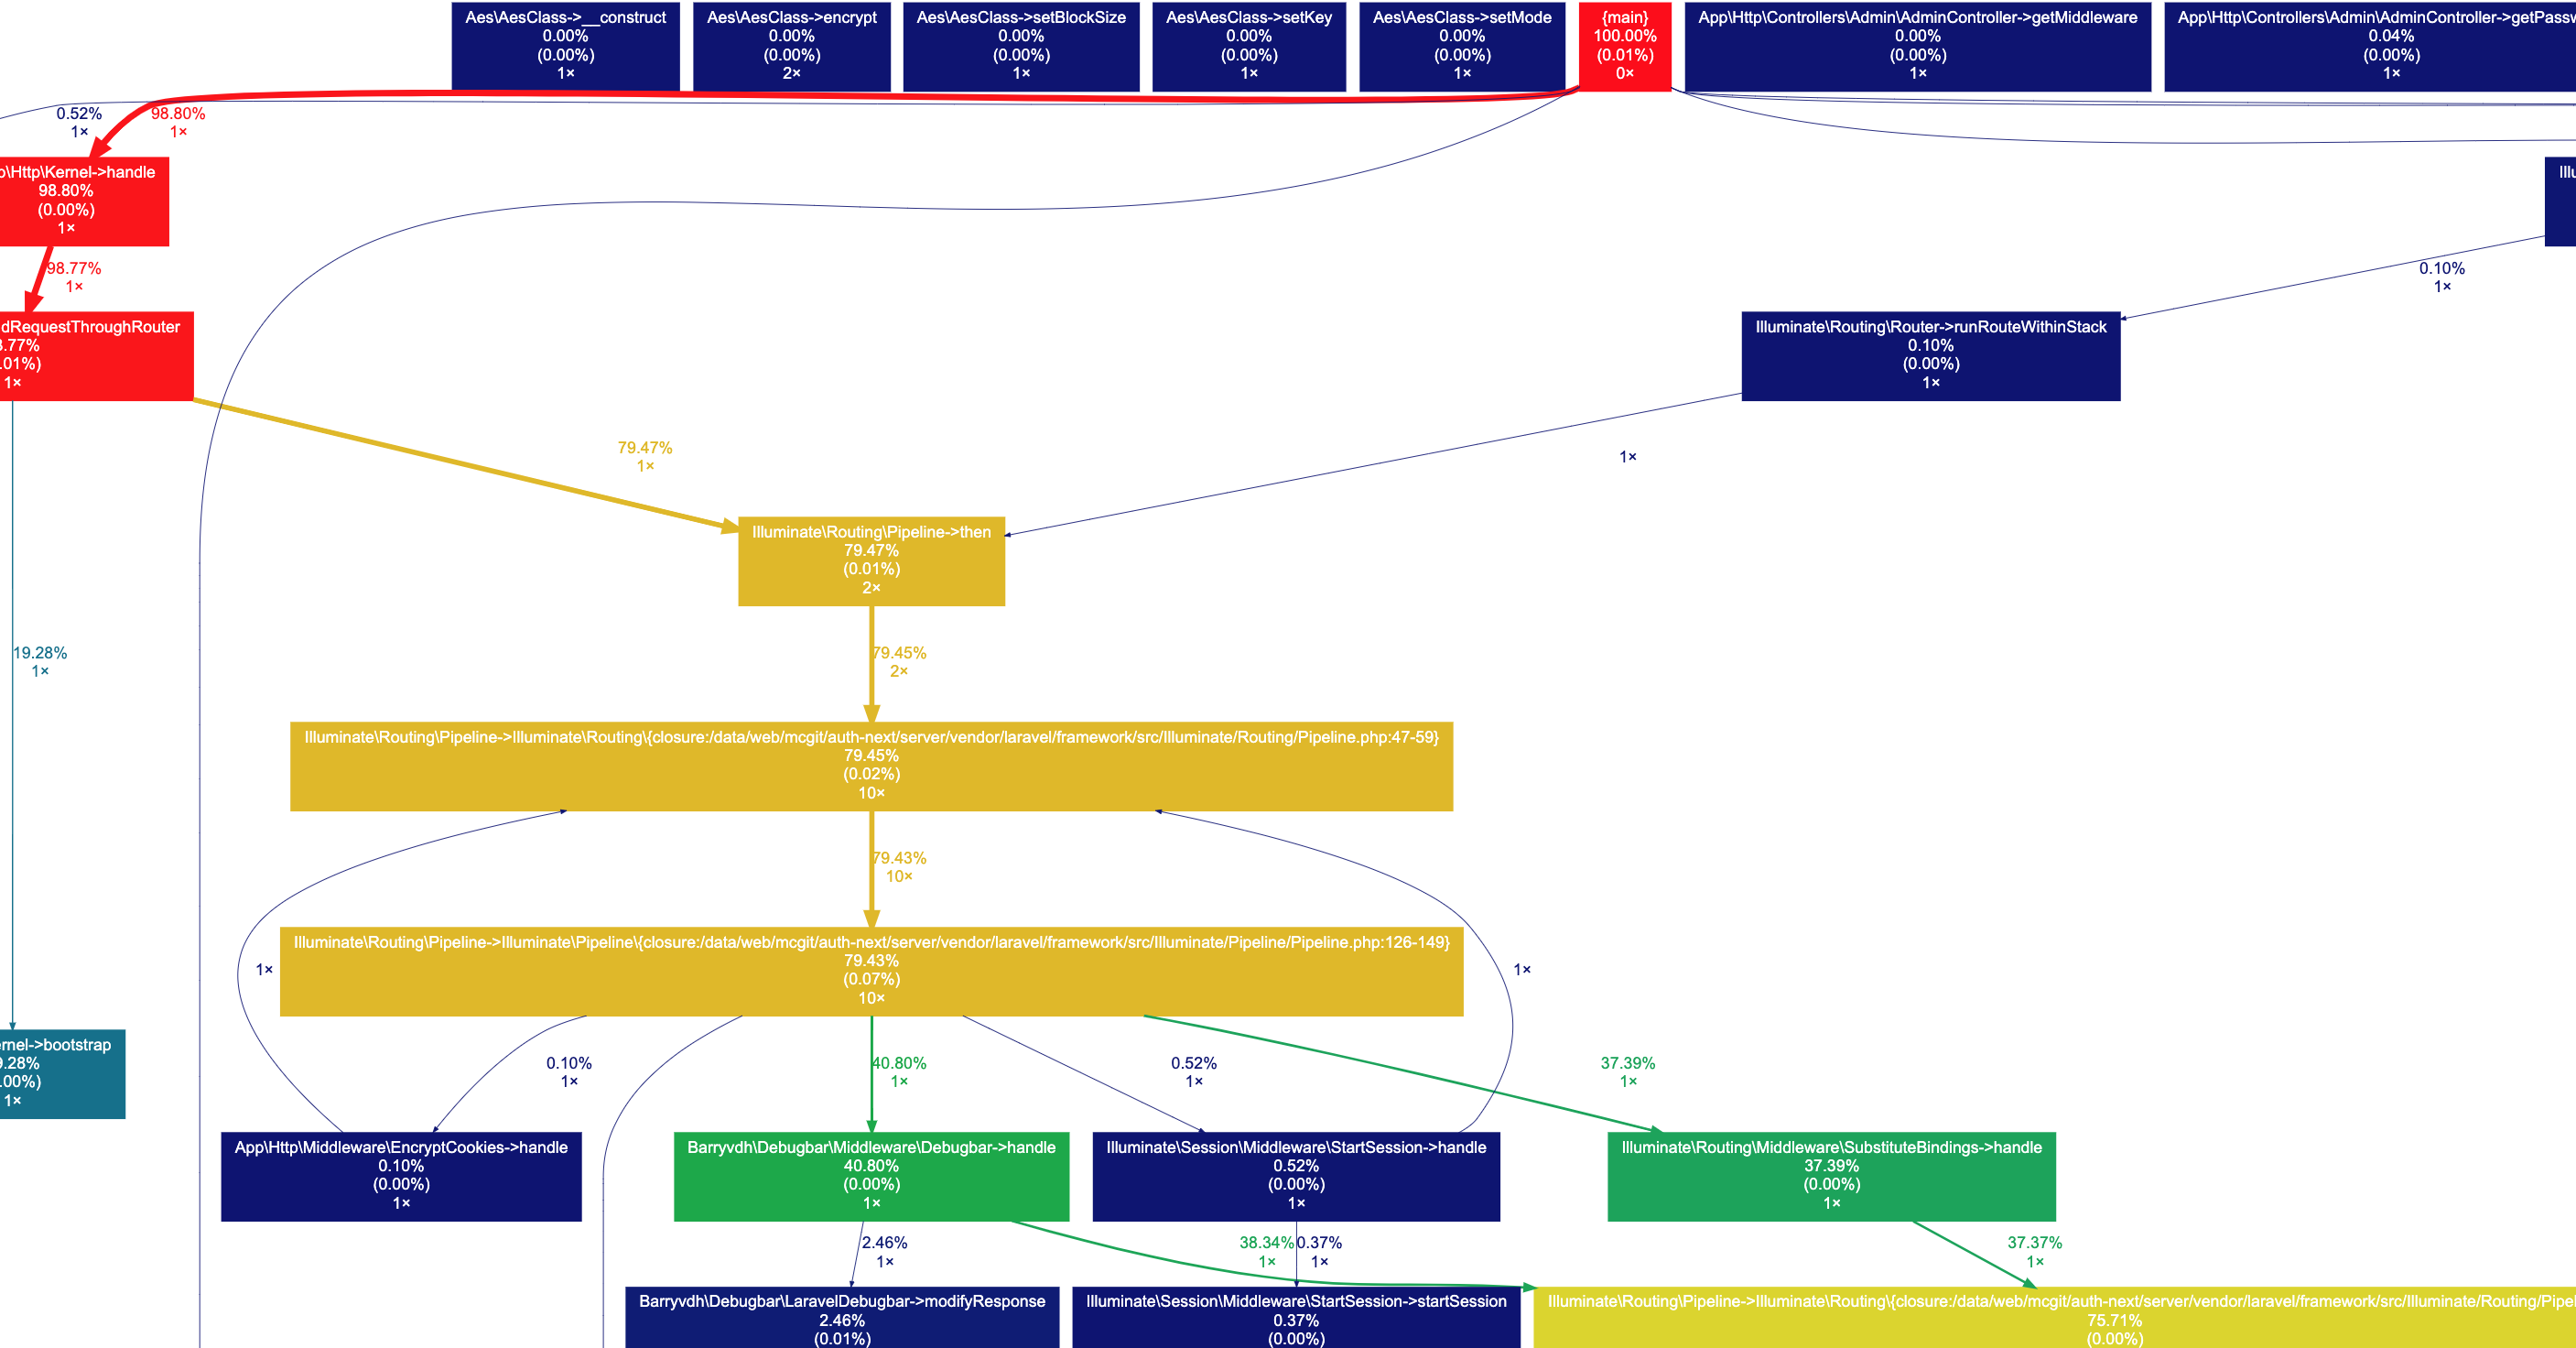
show call graph
查看graph图,查看调用过程最耗时的地方
curl -o /dev/null -s -w '%{time_connect}:%{time_starttransfer}:%{time_total}\n' -i "请求链接"